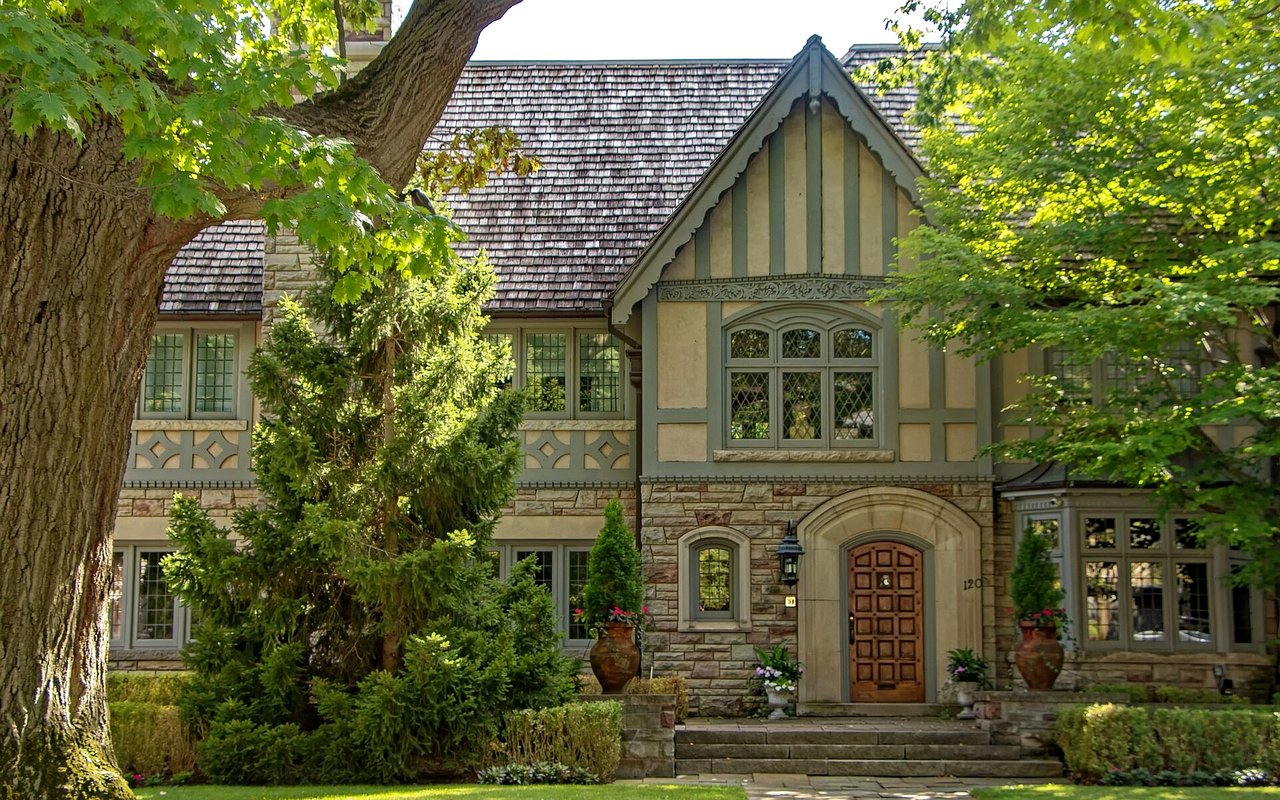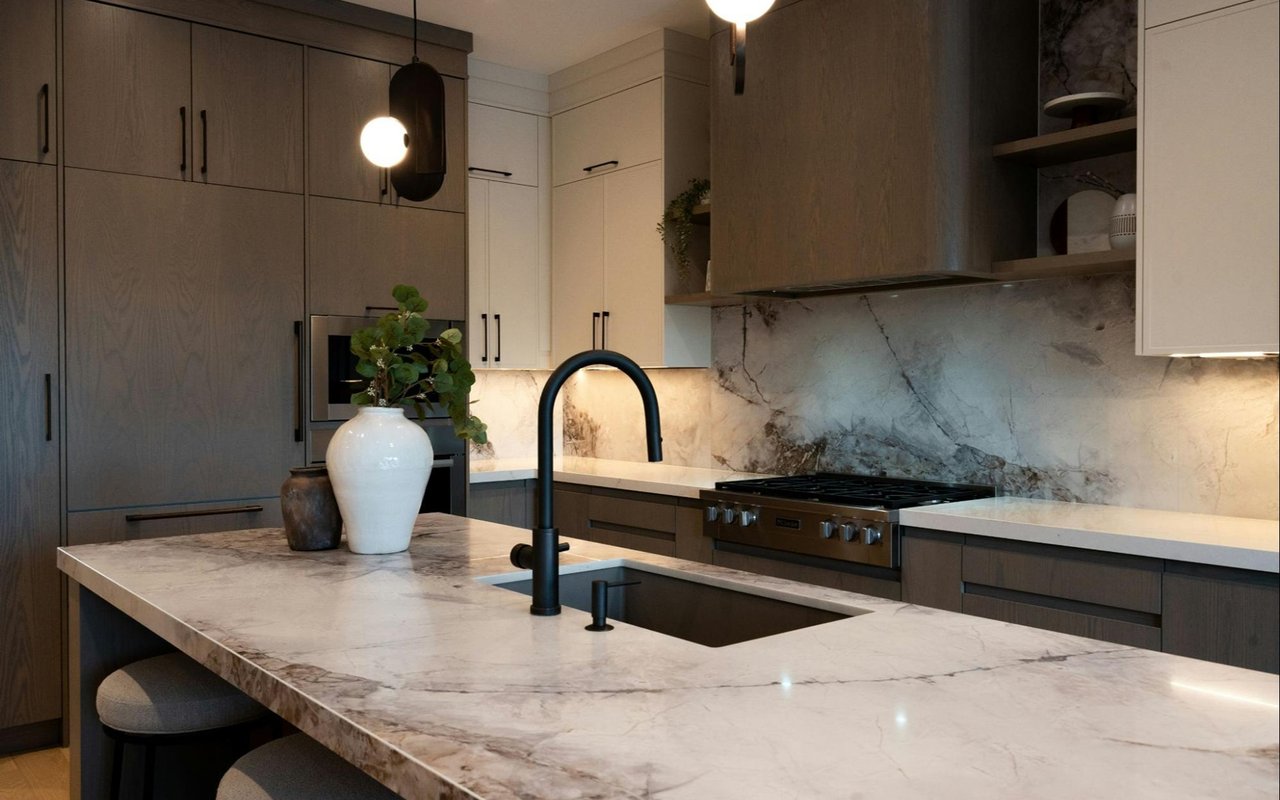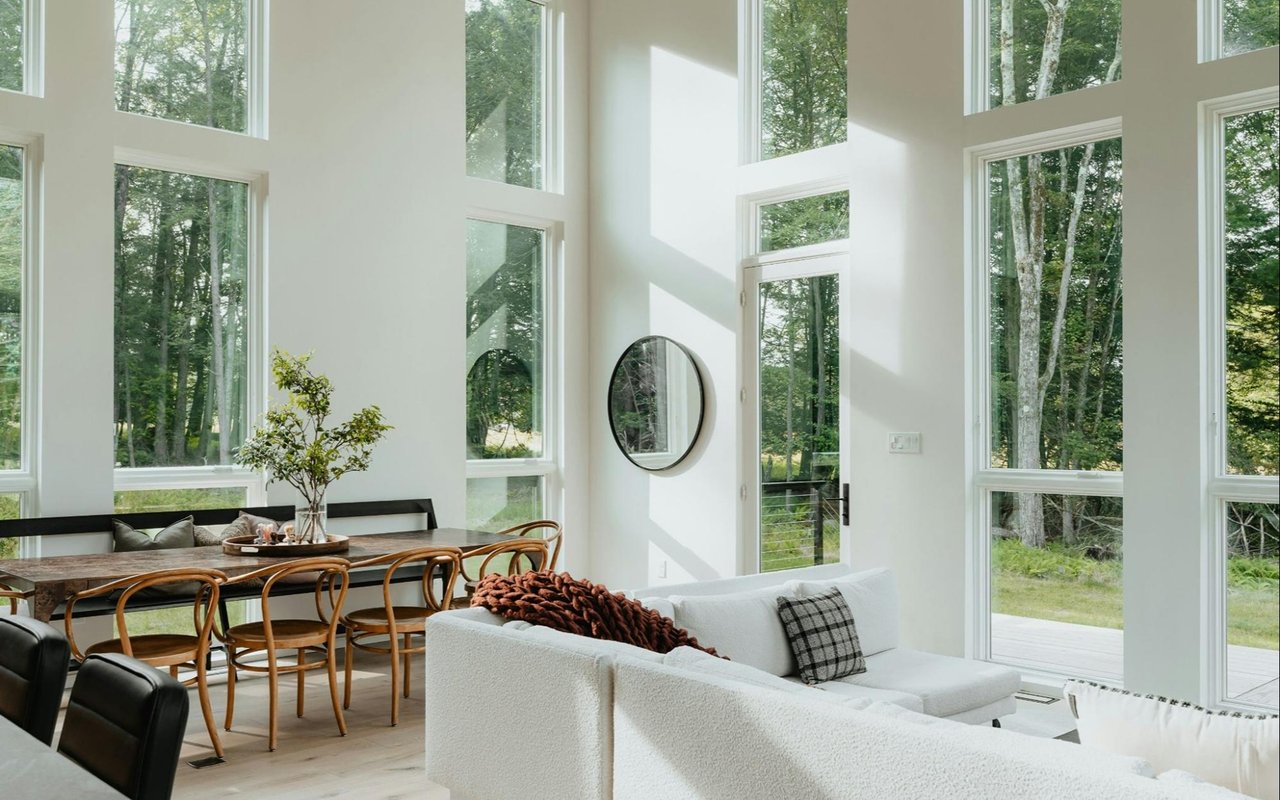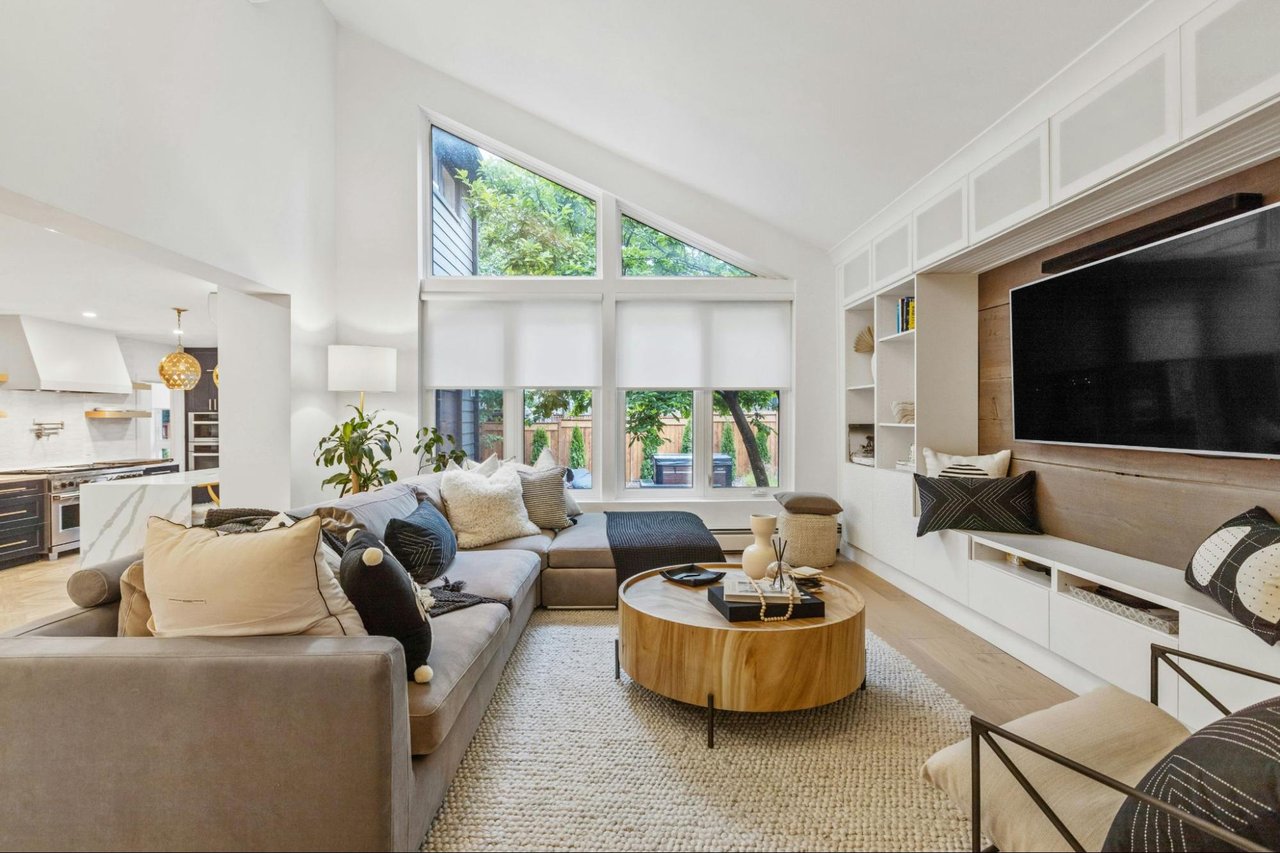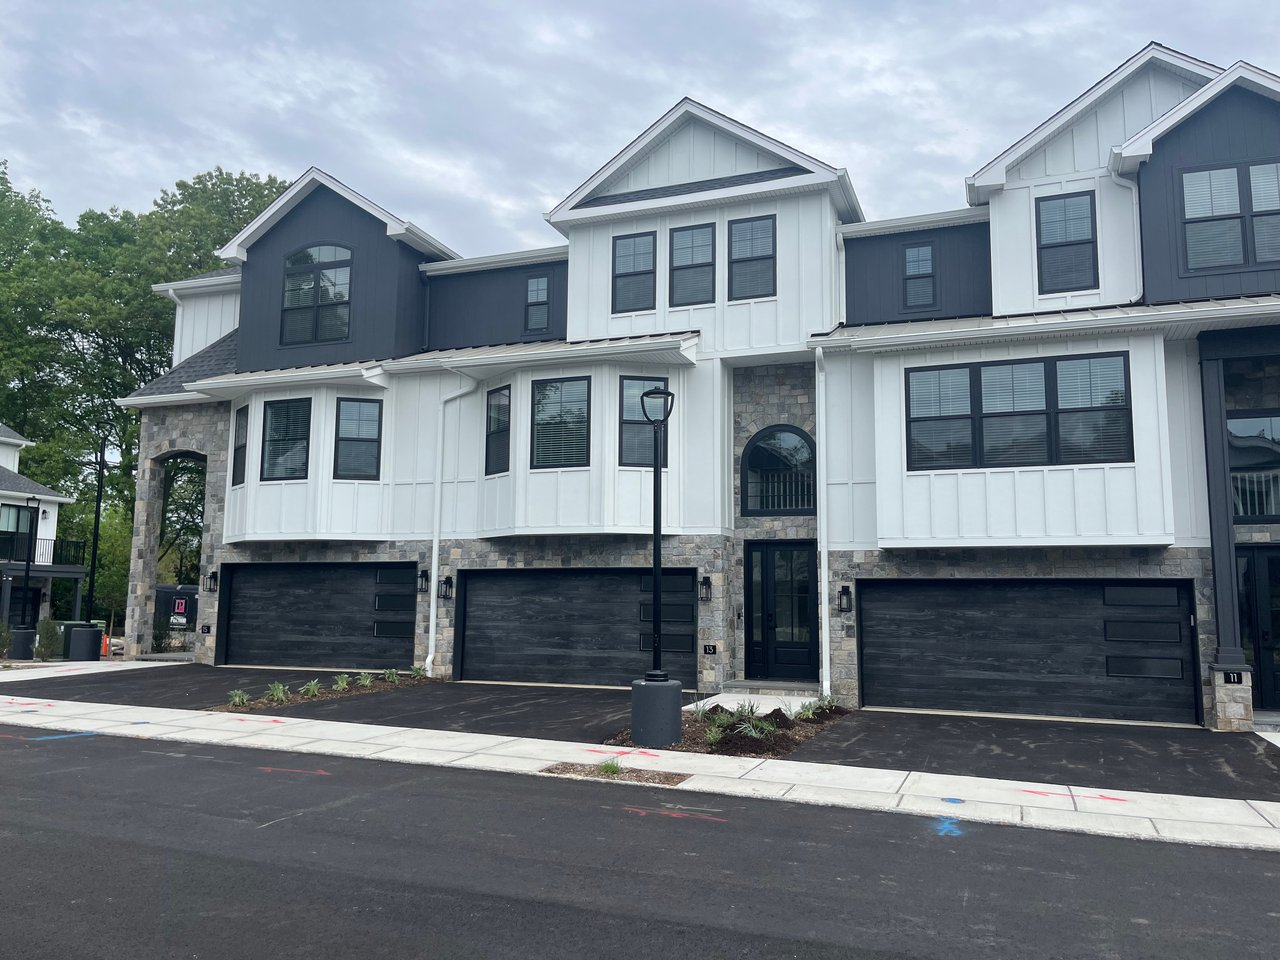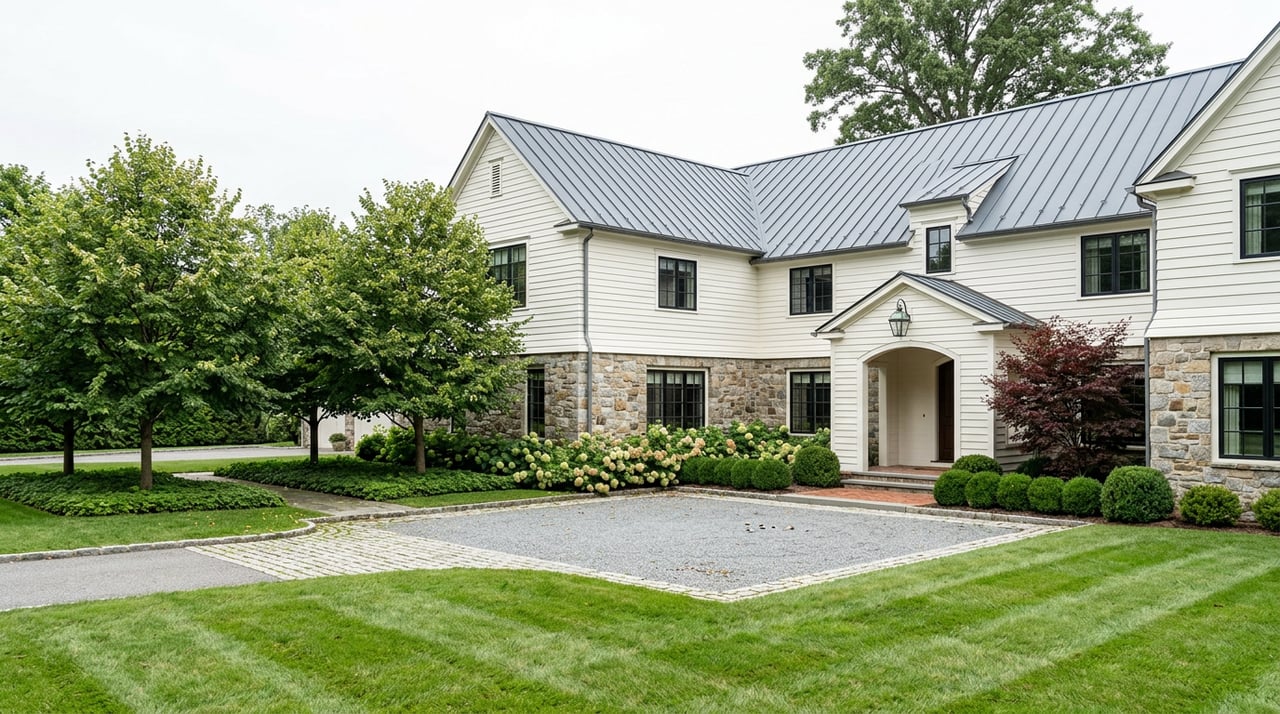
In March 2026, a newly built home at 645 Summit Street closed for $5.4 million, the highest residential sale ever recorded on NJMLS for Englewood Cliffs. It broke the previous benchmark of roughly $4.77 million. If you were watching the town's headline numbers, you would not have noticed. The median price most portals were reporting for Englewood Cliffs barely budged, and by some measures it actually slipped.
That gap is not a data error. It is the whole story. Englewood Cliffs is running two housing markets inside one ZIP code, and the town-wide median blends two things that do not behave the same way. If you are comparing this borough to Tenafly, Cresskill, or Alpine using a single number pulled off a portal, you are treating a single number as if it could describe both a Ferrari and a well-kept 1978 Buick—and calling it a Honda Accord.
The Same ZIP Code, Four Different Numbers
Pull Englewood Cliffs data from four sources across different reporting windows and you get four different pictures of the market:
| Source | Figure | Window |
|---|---|---|
| Zillow's home value index | $1.83M average home value, up 8.8% year over year | as of June 2026 |
| Homes.com | $1,775,000 median sale price, down about 2% year over year | trailing 12 months through mid-2026 |
| Redfin | $1.9M median sale price, up 33.8% year over year, but price per square foot down 16.3% | as of October 2025 |
| Redfin's new-construction filter | $3.69M median listing price across six active new builds | mid-2026 |
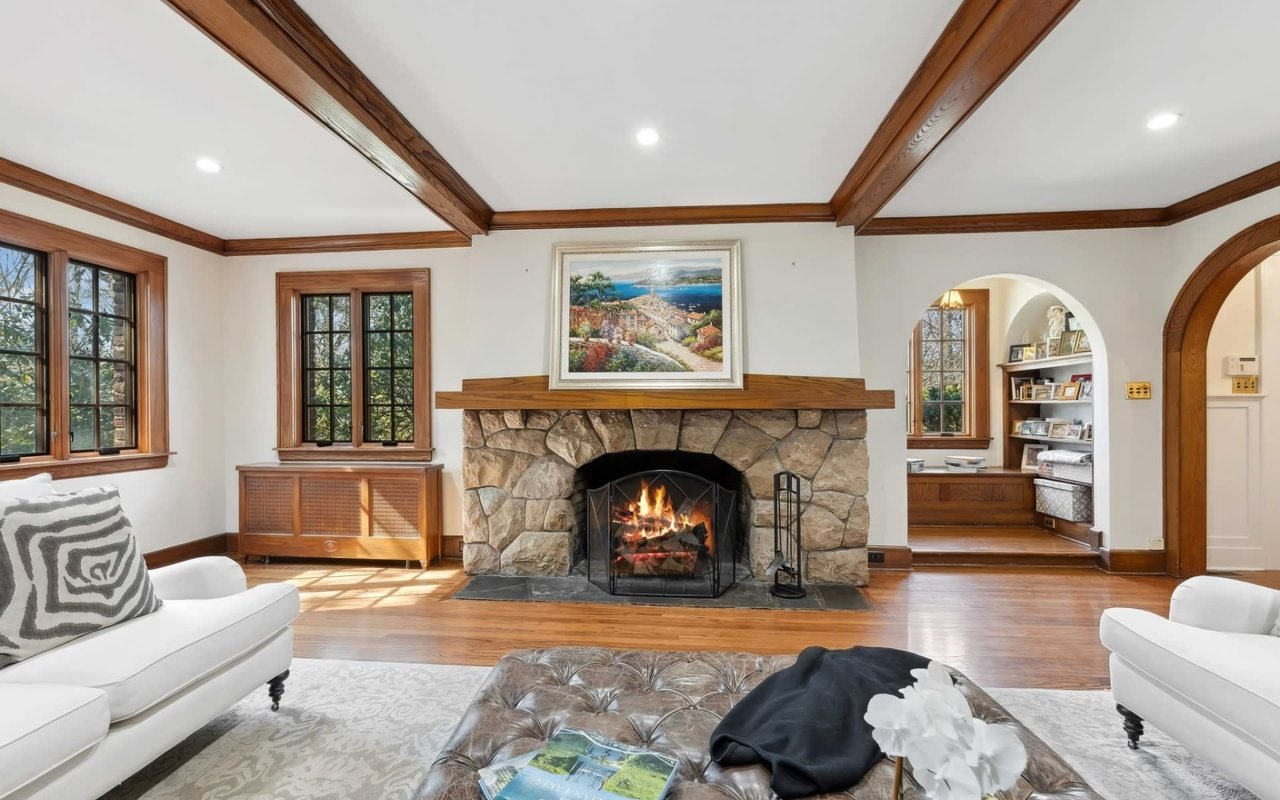
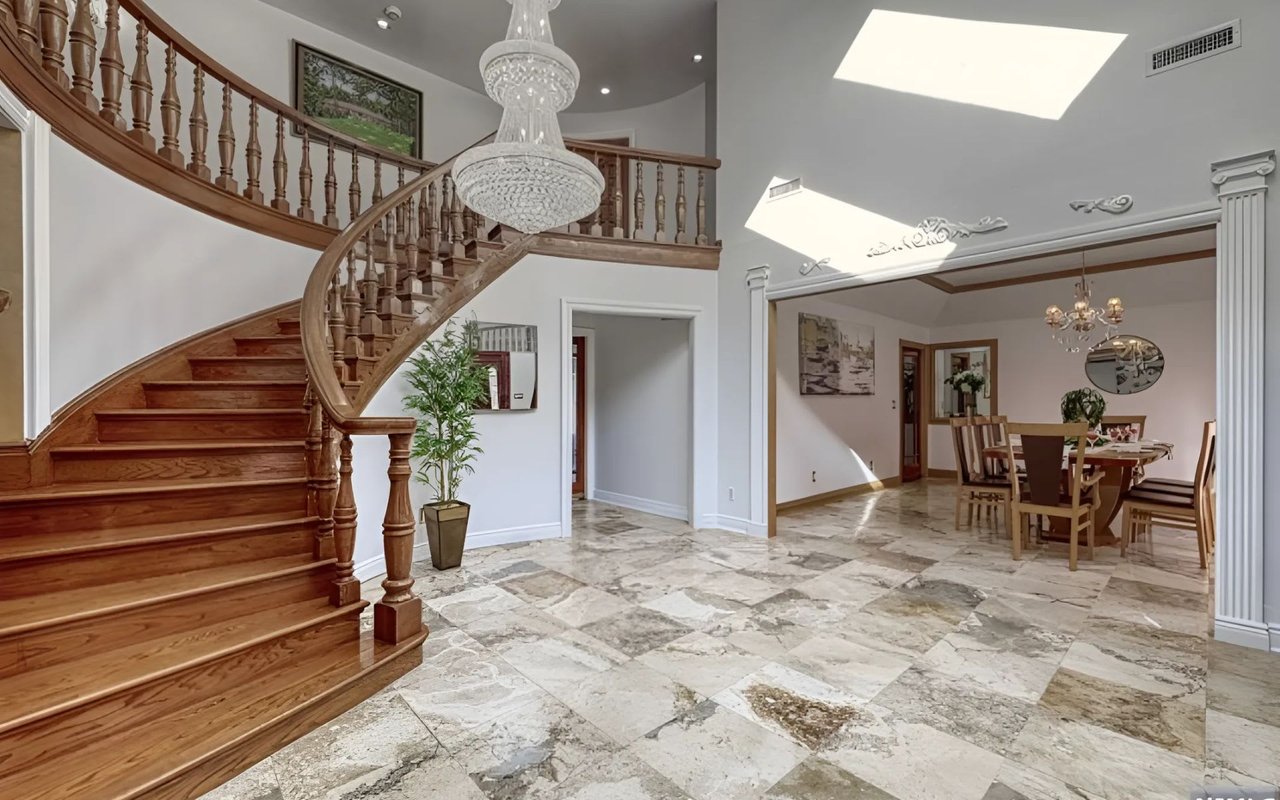
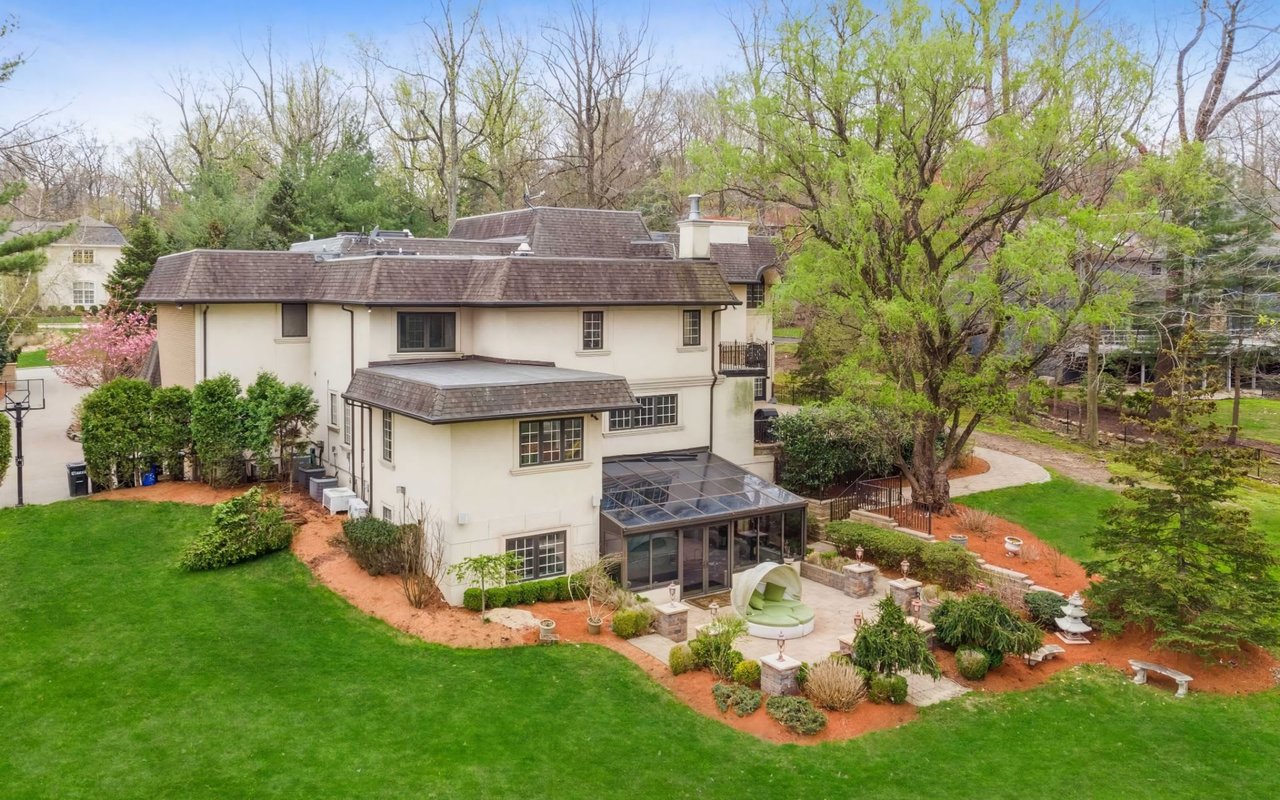
None of these are wrong. They are each sampling a different slice of the same market. The town median falls because older colonials and 1970s split-levels are sitting longer and pulling price per square foot down, even as the new-construction tier is climbing and closing near list. Blend the two together and you get a number that describes neither buyer.
What a Record Sale Actually Tells You
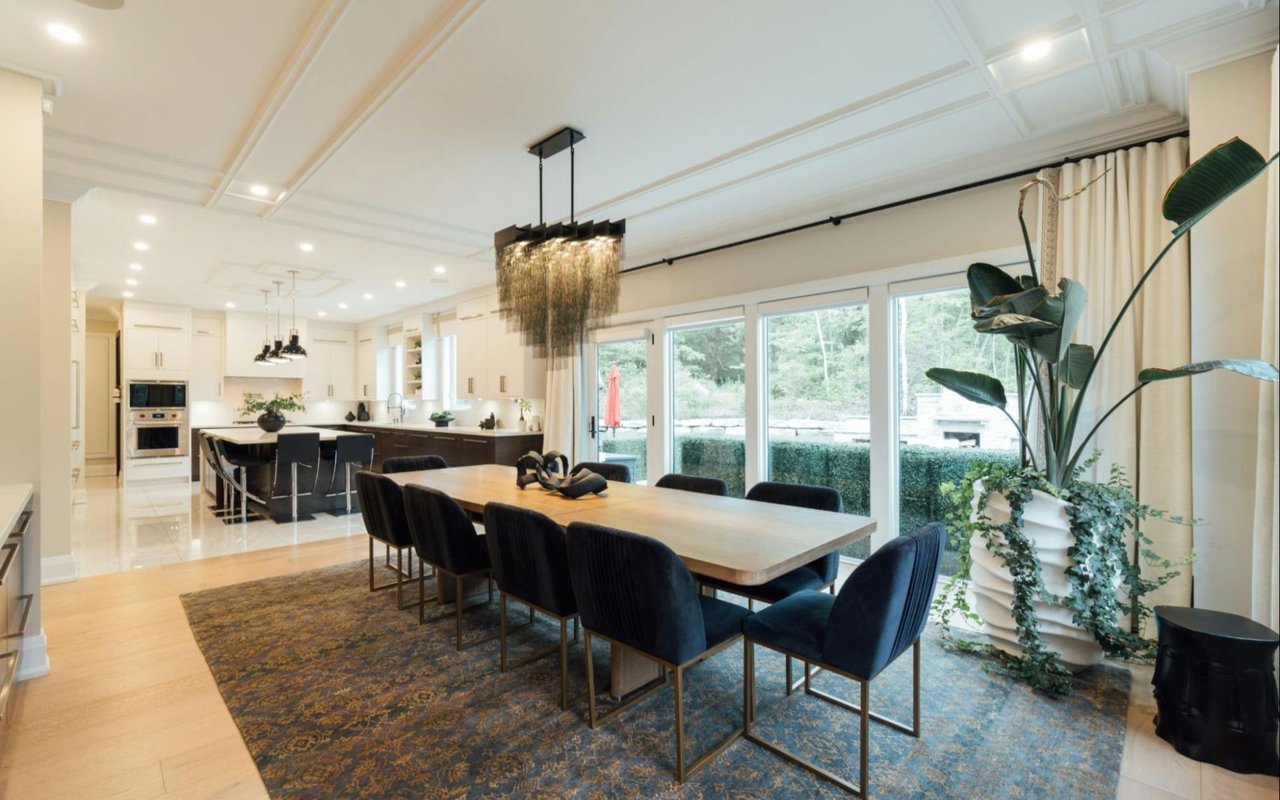
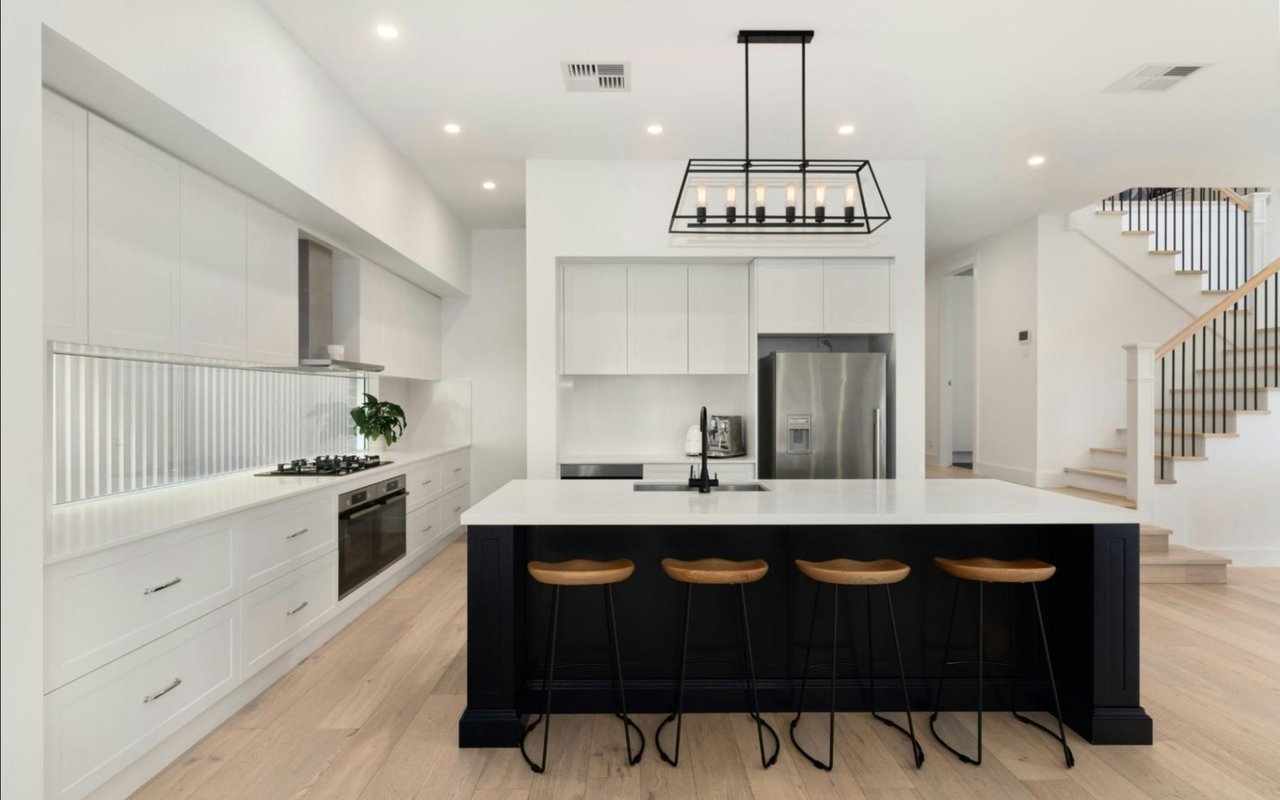
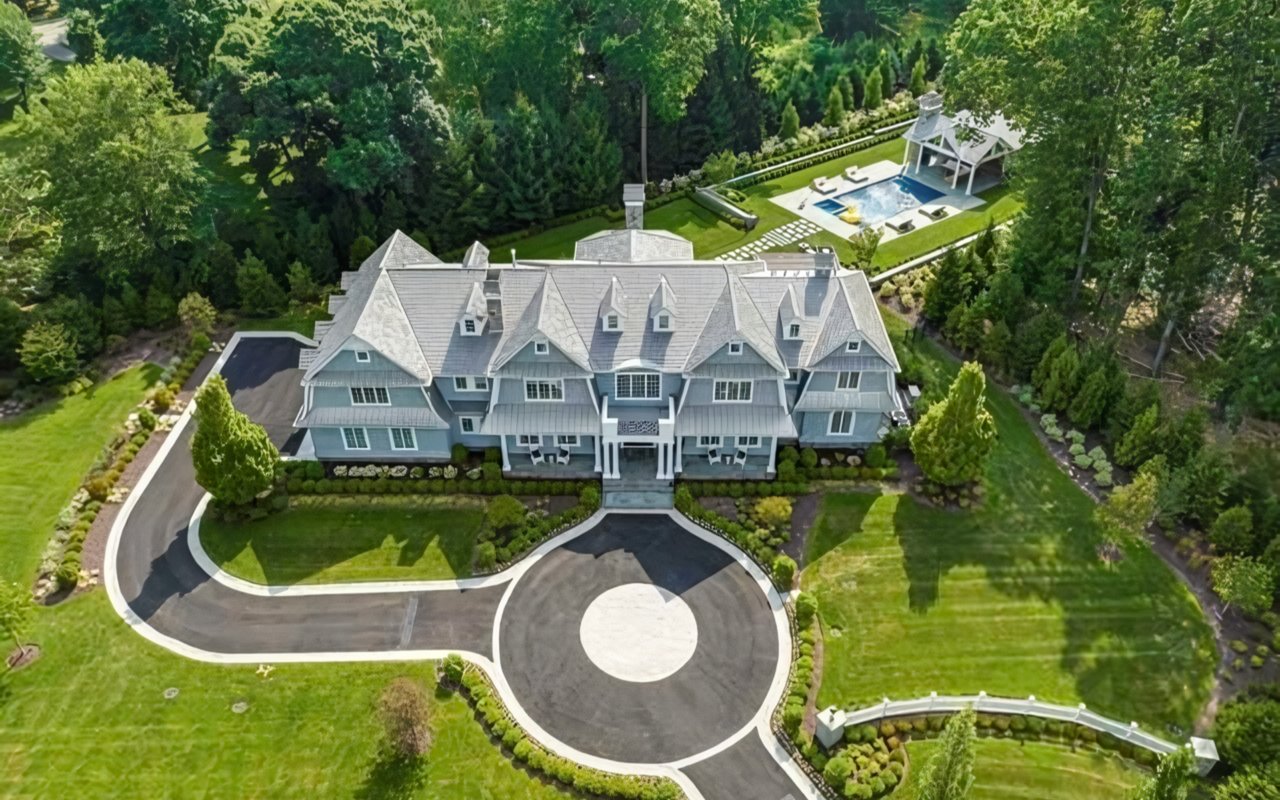
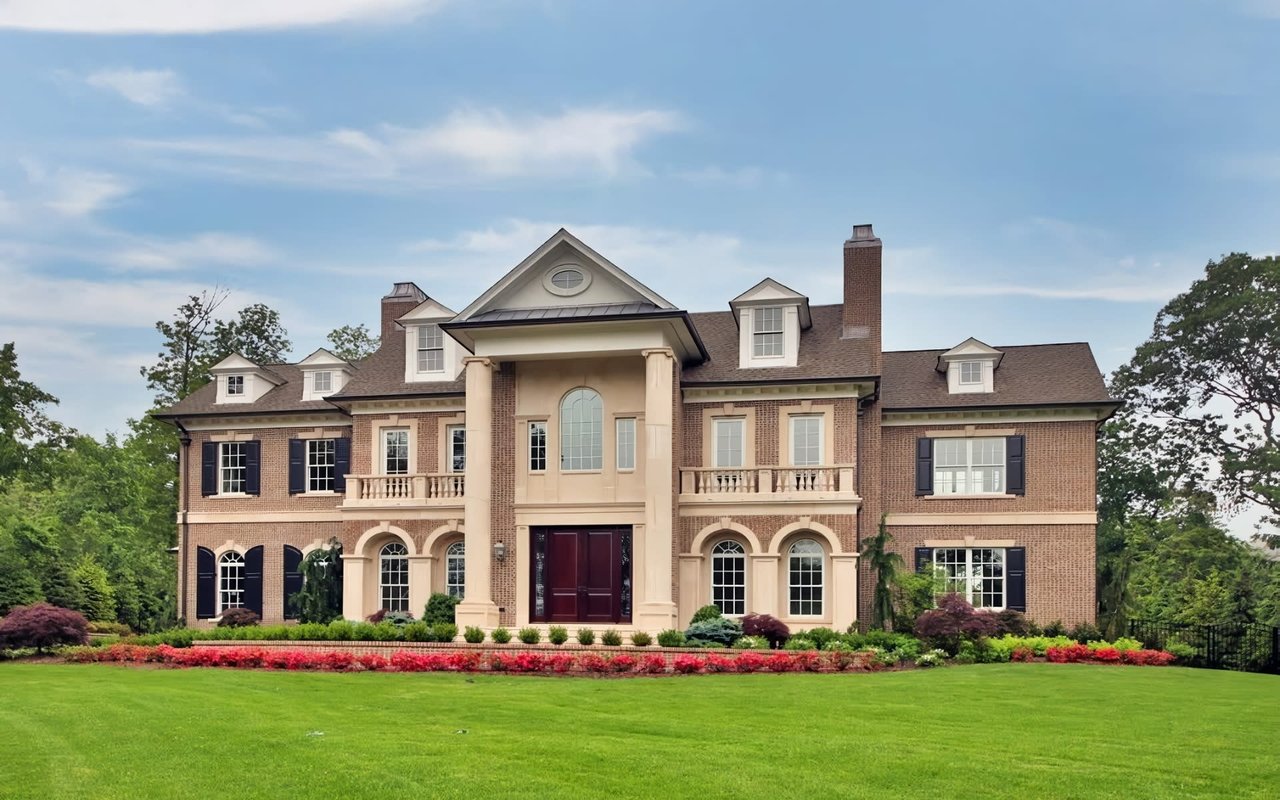
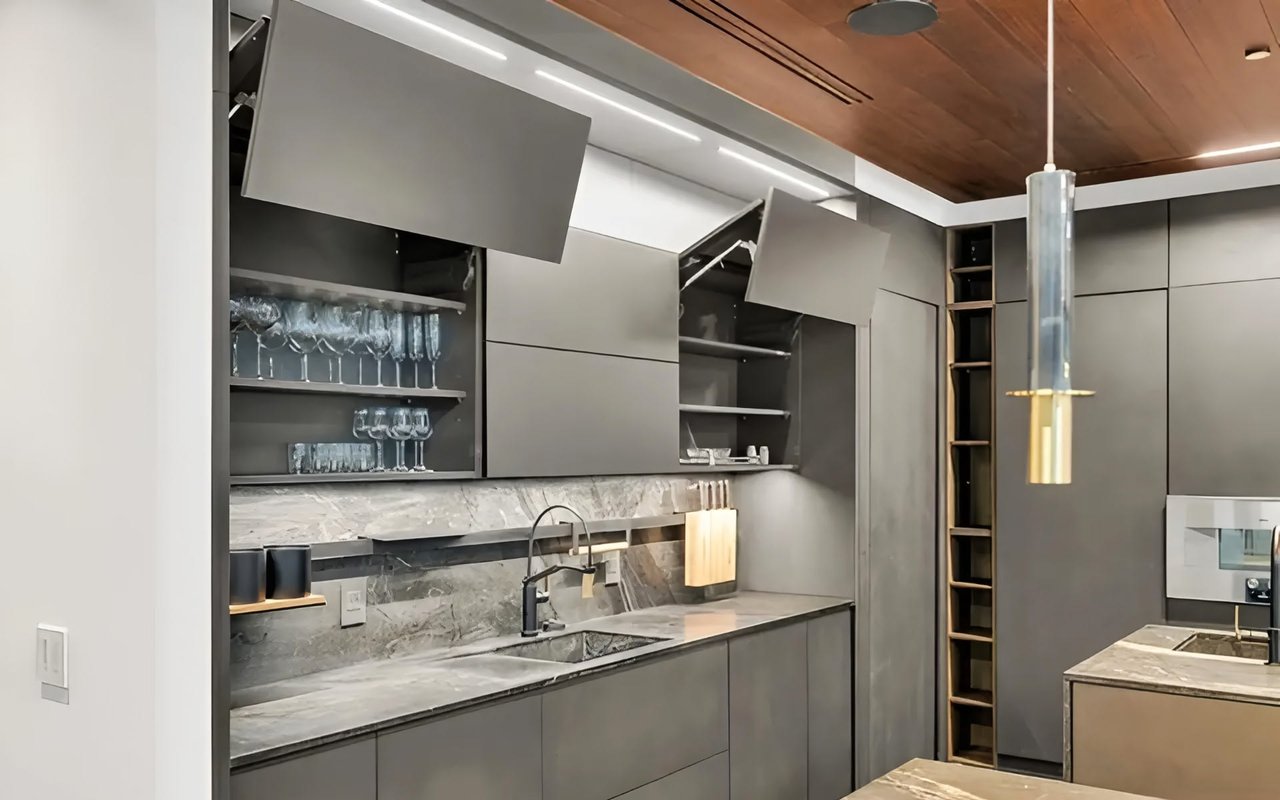
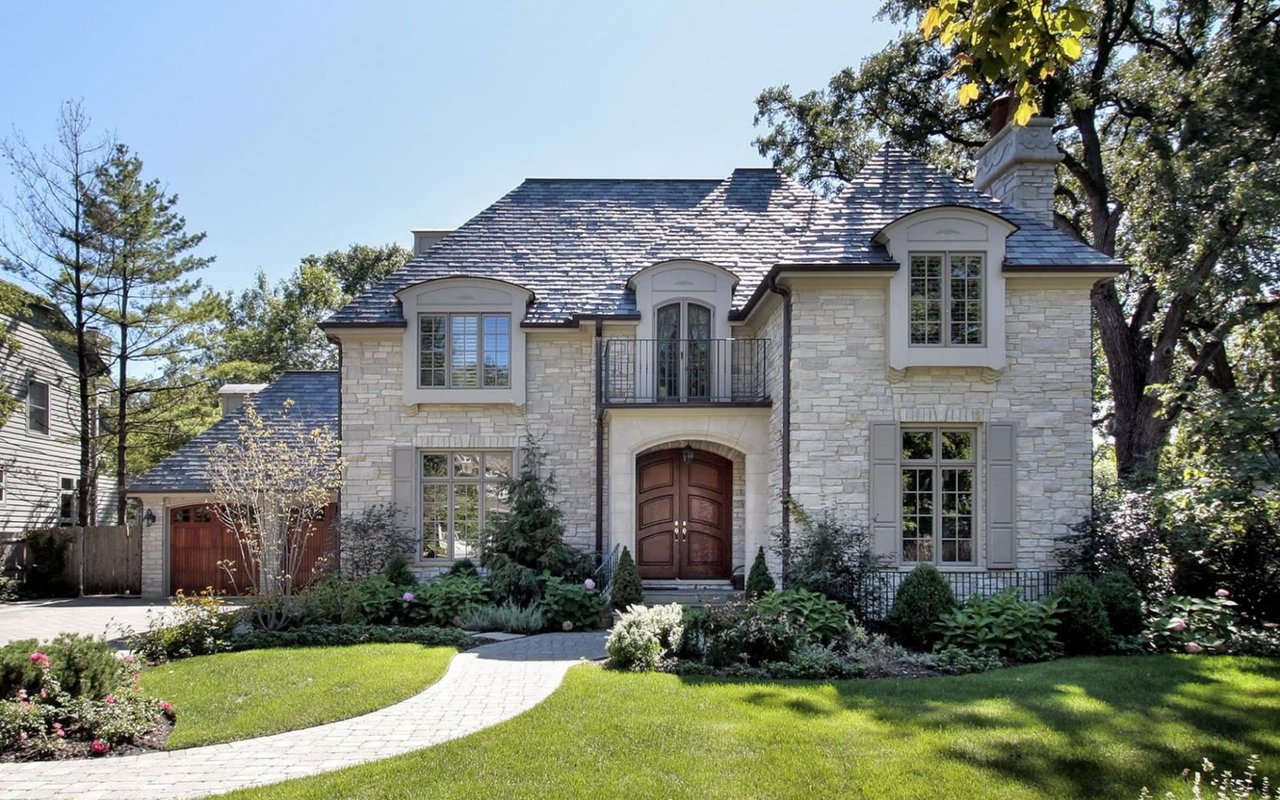
The 645 Summit Street closing was not a legacy estate changing hands. It was architect-driven new construction, designed by Jordan Rosenberg with interiors by Vanessa DeLeon, and it reset the ceiling for the borough in a matter of weeks rather than months. That is the pattern showing up across the North Cliffs and Roberts Road corridor right now. As of mid-2026, six homes marketed as new construction were active in Englewood Cliffs at a median listing price of $3.69 million. One of them, an 11,500 square foot residence on Roberts Road with three elevator-serviced levels, a heated gunite pool, and a 550-bottle wine room, was listed at $5.9 million. Another, a 7,200 square foot chateau-inspired build from a local developer, offered six bedrooms and an infinity pool at a comparable price point.
None of this activity shows up as a spike in the town median, because the median is diluted by a much larger base of older resale inventory that is not moving at the same pace. A buyer anchored to the $1.9 million Redfin figure who tours a Roberts Road spec home will conclude the market has lost its mind. A buyer anchored to $3.69 million who tours a well-kept 1970s ranch will conclude the opposite. Both are shopping the same borough. Neither is shopping the same market.
The Ten-Year Pattern Behind the Split
This is not a one-season anomaly. New Jersey Multiple Listing Service figures for Englewood Cliffs show the town's average sale price climbing from $1.30 million in 2016 to $2.07 million in 2025, a compounding move that tracks almost entirely with the growth of the architect-driven new-construction segment. Over the same decade, average days on market fell from 116 to 61, touching a low of 42 days in 2024 before easing slightly in 2025. The sale-to-original-list-price ratio, a cleaner read on how disciplined pricing has to be to close, moved from 87.97% in 2019 to a decade high of 98.49% in 2024, finishing 2025 at 97.31%.
Read together, those three numbers describe a market where the top tier is not simply expensive. It is disciplined. Homes that are priced and finished correctly close near list in weeks. Homes that are not sit for months and eventually pull the town's blended figures down, which is exactly why a portal's headline median and a walk down Roberts Road can tell two contradictory stories in the same month.
A Second Data Point: The Sylvan
You do not have to rely on the for-sale market alone to see this split. A few hundred yards from some of the newest construction, Garden Communities finished leasing the first phase of The Sylvan, a 338-unit apartment building and 112 rental townhomes built on the site of the former Unilever campus on Sylvan Avenue. According to Garden Communities principal Brett Tanzman, nearly half of the townhome units were already leased before the community formally opened, with market-rate rents starting around $2,950 a month for a one-bedroom. A separate 90-unit affordable component opened its application lottery in June 2026, with priority given to applicants who live or work in Bergen, Hudson, Passaic, or Sussex counties.
The Sylvan spent close to a decade in litigation before a single unit leased. That it filled this quickly once it opened is a second, independent signal that demand for new, amenity-rich product in this specific corridor of Bergen County is not a fluke limited to the for-sale side. Buyers and renters are both responding to the same thing: proximity to the George Washington Bridge, a Palisades setting, and product built to a current standard rather than a 1970s one.
How to Read a Listing Before You Anchor a Number
If you are comparing Englewood Cliffs to a neighboring town, or trying to decide whether a specific listing is priced fairly, the town median is not a useful starting point on its own. A few questions do more work:
Is the home new construction or a renovation of an existing footprint, or is it original to its build year? The gap between these two categories is now measured in millions of dollars, not tens of thousands.
Which street is it on? Roberts Road and the North Cliffs section are where the architect-driven product is concentrated and where days on market compress the most. A comparable finish level on a different street may sit longer simply because it is competing for a different buyer.
What did the sale-to-list ratio look like for genuinely comparable homes in the last twelve months, not for the town as a whole? A 97% ratio townwide can coexist with 90% ratios on slower resale stock and 100%-plus bidding on the right new build.
None of this is a reason to avoid Englewood Cliffs. It is a reason to price and position a specific home against its actual peer set rather than against a townwide figure that was never describing that home in the first place.
Frequently Asked Questions
Does the March 2026 record mean prices are rising everywhere in town? No. The record reflects strength in the new-construction tier specifically. Older resale inventory in the same period has shown softer price-per-square-foot figures, which is why the townwide median can look flat even as the top of the market sets new highs.
Why did some portals show the median falling while others showed it rising? Each portal pulls from a different mix of listing data, sold data, and time windows. When a market has two distinct product tiers moving at different speeds, small shifts in which properties fall into a given reporting period can swing the headline number substantially without reflecting a real change in either tier.
Is new construction always the safer bet in Englewood Cliffs? Not automatically. The data shows new construction closing faster and closer to list, but that reflects buyer demand for a specific product, not a guarantee about resale value or fit for every household. A well-maintained older home on the right lot can still be the better decision depending on your priorities.
Englewood Cliffs rewards a buyer or seller who treats the headline number as a starting question rather than an answer. If you are trying to figure out which market a specific address actually belongs to, or how to price a listing against the right peer set rather than a townwide blend, The Kolsky Team has spent decades reading Bergen County street by street. Search properties or get a home valuation built around the tier your home actually competes in.